 Bridge TEFL
  Expert Series Webinars
  BridgeUniverse Blog
  TEFL Jobs
  Language Training
  About Bridge


— Our Blog —
Global ELT News
Get the latest ELT news! Our international network of journalists are always on the hunt for the latest and greatest news in the English language teaching space around the globe, so you can stay informed. Hear about breaking industry topics, international trends and issues, and other news relevant to you and your career.
-
November 30, 2023

Leveraging English Proficiency Testing in Academics and Employment
By Linda D'Argenio
English language testing constitutes a significant part of the English teaching industry. Every year, millions of students take various tests to demonstrate their proficiency in English. To put this in...
-
December 16, 2025

From Talk to Text: What Peer Learning Really Builds
By Bridge
This is a guest post contributed by Bridge’s M.A. TESOL university pathway partner, University of St. Andrews. “Make sure you let the learners discuss their ideas before asking them to... -
November 20, 2025

How TESOL Specializations Shape Better Teaching and Learning
By Bridge
This is a guest post contributed by Bridge’s M.A. TESOL university pathway partner, Westcliff University. In a diverse world of English language teaching and learning, many pathways and specializations offer...
-
November 3, 2023

Navigating Today’s ELT Job Market: A Guide to Industry Trends and Expanding Niches
By Savannah Potter
The current English Language Teaching, or ELT, market is thriving both online and in schools around the world. With the growing number of opportunities comes more competition for the best... -
September 28, 2023

Choosing an LMS or Learning Platform for Your Online English Teaching Business
By Linda D'Argenio
Are you an independent online English teacher with a growing private tutoring business? Until now, you may have used free video-conferencing software and handled student management and administrative tasks on...
-
July 15, 2025

Adaptive, Data-Rich, and Immediate: The New Language Assessment Powered by AI
By Shélynn Riel
Language assessment is undergoing a profound transformation, driven by the rapid advancements in Artificial Intelligence (AI). In an era where language skills are more crucial than ever for academic, professional,... -
June 4, 2025

Pedagogy First: Frameworks for Integrating Technology and AI With Purpose in ELT
By Shélynn Riel
Technology has long been a fixture in English Language Teaching (ELT), from cassette tapes and language labs to mobile apps and adaptive platforms. But in today’s educational landscape, where generative...


-
May 5, 2025

AI-Enhanced Speaking Practice: A New Era in Personalized, Real-Time, and Immersive Language Learning
By Shélynn Riel
In the rapidly evolving landscape of English Language Teaching (ELT), artificial intelligence (AI) is increasingly reshaping how educators and learners approach language acquisition. One domain experiencing a noteworthy shift is... -
April 24, 2025

BBELT 2025 Highlights: Innovation, Adaptability, and Growth in ELT
By Ricardo Cifuentes
The 2025 BBELT Conference brought together English teaching professionals from around the world in a rich, all‐online setting. Centered around the theme “Shaping Brighter Futures Through ELT,” the event was... -
April 1, 2025

The Future of English: In Conversation With David Crystal
By Rashmi Chugani
What’s the future of English in our hyper-connected, tech-driven world? Renowned linguist and author David Crystal shared his thoughts on the state of English as a global language and its... -
March 18, 2025

The Rise of Business English as a Lingua Franca: Trends in Business English and Corporate Language Training
By Shélynn Riel
By 2030, the global English Language Training (ELT) market is projected to reach $129.3 billion, reflecting a 7.5% compound annual growth rate. A key contributor to this growth is the... -
March 11, 2025

Integrating Technology With Purpose: Key Takeaways From Educast International Conference 2025
By James Padgett
Technology is present in most, if not all, areas of our lives. This reality creates a necessity for educators to compete for their students’ attention by engaging them in content... -
March 4, 2025

Connecting Teachers Globally: Insights From the 2025 Macmillan Global Teachers’ Festival
By Ricardo Cifuentes
The 2025 Macmillan Global Teachers’ Festival brought together teachers from all over the world. For ten days, experts shared ideas, teaching methods, and new trends in education. The sessions covered... -
January 21, 2025

Teaching Smarter, Not Harder With AI-Powered Content Creation
By Shélynn Riel
As technology becomes more integral to education, generative AI is transforming how English Language Teaching (ELT) professionals approach lesson planning, activity creation, and resource development. This new wave of AI... -
January 11, 2025

Preply: An Innovative Platform Empowering Teachers and Connecting Learners Worldwide
By Rashmi Chugani
Since 2012, Preply has been on a mission to make language learning more effective and accessible for everyone. The platform was founded by Ukrainian entrepreneurs Kirill Bigai, Dmytro Voloshyn, and... -
December 3, 2024

The Case for Celebrating Fluency in Conversational English
By Gustavo Fróes
There has been an unprecedented shift in the global landscape of English language education worldwide. Schools and organizations have increasingly prioritized conversational fluency over rigid grammatical perfection, recognizing that effective... -
October 6, 2024

Tech-Driven Solutions: Learn About Global Language Assessment Provider Bright Language
By Rashmi Chugani
A pioneer in language assessment, Bright Language has been a preferred language proficiency assessment provider to organizations around the world for more than 30 years. An early adopter of advancing... -
September 27, 2024

The Importance of Transferable Skills for ESL/EFL Students
By Jennifer Maguire
In today’s rapidly evolving world, the ability to adapt, communicate effectively, and solve problems creatively is more important than ever. For ESL students, transferable skills are crucial for success in... -
August 4, 2024

The Rise of CLIL in Global Education Systems
By Jennifer Maguire
In a globalized world, multilingualism has become increasingly important. In response to this, the progressive educational approach of Content and Language Integrated Learning (CLIL) is seeing global adoption as a... -
June 30, 2024

Global Perspectives: EF’s 3rd Annual Online English Teacher Conference
By Krzl Light Nuñes
Keeping online English teachers abreast of timely issues and the latest tech and online teaching methodologies, EF Teach Online held its 3rd Annual Online English Teacher Conference on June 21st.... -
June 29, 2024

Tech-Driven Transformation: How Technology is Revolutionizing English Language Teaching
By Jennifer Maguire
The language learning market is vast, and like so many other industries, it’s evolving with technological advances. Language learners are today’s largest cohort of learners around the globe with one... -
October 5, 2023

PTE: A Testing Success Story
By Rashmi Chugani
The Pearson Test of English (PTE) launched worldwide in 2009. Since then, it has become a leading exam for study applications worldwide, and for visa applications for work and migration... -
September 1, 2023

Introducing the Teacherpreneur Academy: Empowering Educators to Launch an Independent Teaching Career
By Savannah Potter
A new kind of entrepreneur has arrived and is changing the landscape of online English language teaching. The teacherpreneur is an independent educator, driven business owner and lifelong student. These... -
August 30, 2023

From Teaching Abroad to Teaching Online: Rise of the Digital Nomad
By Savannah Potter
A new day breaks and online English teacher Andrea Beatriz Collados settles in at her desk in her home in Buenos Aires, Argentina to start a new day of teaching.... -
July 27, 2023

Debunking the Methodology Myth: Identifying Multiple Methods of ESL Instruction
By Linda D'Argenio
Choosing an effective foreign language teaching methodology is a concern common to many language teachers. In the case of teaching English as a second or foreign language, this concern is... -
July 23, 2023

No Teacher Left Behind: An Empowering 19th BRAZ-TESOL Conference
By Krzl Light Nuñes
With a spotlight on equipping the English language teaching community with the skills, tools, and best practices for current and future trends, BRAZ-TESOL convened ELT educators from Brazil and abroad... -
July 4, 2023

Demand for Business English Continues to Grow Exponentially – Learn the Ins and Outs of This Lucrative ELT Niche for Teachers
By Shélynn Riel
In today’s competitive world, acquiring proficiency in the English language has become essential, and learning Business English is fast becoming a necessity, as English is the lingua franca, the international... -
May 31, 2023

Post-COVID Online English Language Market Sees Continued Growth
By Jennifer Maguire
Denver, Co – The global English language learning market is growing, but the market segment to watch in the coming years may be the online learning component of the industry.... -
May 14, 2023

From Decolonizing ELT to Embracing Multimodal Approaches, IATEFL 2023 Delivered Calls to Action
By Shélynn Riel
I arrived at Harrogate station feeling contemplative and eager to experience my first IATEFL conference. The view from the train into the North Yorkshire, England town of Harrogate is idyllic... -
April 27, 2023

We Plan, You Teach: A Closer Look at ESL Lesson Plan Companies
By Jennifer Maguire
ESL lesson plan companies offer ready-made resources for teachers Denver, Co. – The aphorism “time is money” may sound pithy, but teachers know the value of time – and how... -
March 30, 2023

Upskilling Opportunities for ELT Industry Grow With Global Shifts, Rise of Private Sector EFL Companies
By Jennifer Maguire
Denver, Co – If you work in education, you’re likely immersed in a culture that greatly values continued professional development, or CPD. In recent years, this idea of continuous growth... -
March 29, 2023

Get to Know ESL Pals: The Company Designing Lesson Plans for Teachers!
By Bridge
In this interview, Raedmund Gibbons, one of the founders of ESL Pals, explains what his lesson planning company offers ESL teachers. 1. Hi, Raedmund! Could you tell us, what is... -
February 26, 2023

Global, Digital Evolution Drives Need for 21st-Century, Transferable Skills in Today’s Employees
By Jennifer Maguire
ESL teachers must prepare students to apply multiple resources and competencies for 21st-century global, digital exchanges Denver, CO – If you work in education, you’ve heard the phrase “21st-century learning... -
February 13, 2023

More Connected Than Ever: Taking Advantage of Global ELT Associations’ Online Offerings
By Shélynn Riel
Since ELT is a global industry, it’s common for teachers to travel the world and teach in various contexts. However, despite forming part of a global industry, English teachers often... -
February 6, 2023

Big Business: High-Stakes English Tests Drive ELT Test Prep Solutions
By Jennifer Maguire
Denver, CO. – As the remote delivery of English language tests becomes more commonplace, resources to prepare test takers have evolved as well. Gone are the days of visiting a... -
August 10, 2022

How English Tutor Marketplaces Are Continuing to Evolve
By Gerald Smith
Whether you are an independent online tutor, an ESL/EFL teacher at a language school or a language school owner or manager, a good grasp of ELT marketplaces is essential for... -
August 2, 2022

Online English Language Testing – Increased Access Comes With Security Challenges
By Jennifer Maguire
Denver, Co. – English language testing has long been used for a variety of purposes, such as hiring and promotions, college and university admissions and immigration. The shift to online... -
June 10, 2022

IATEFL CONFERENCE 2022
By Gerald Smith
Everyone eagerly put real faces to names they knew only from Zoom calls or Linkedin. Walking into the hall of the 55th International Association of Teachers of English as a... -
May 27, 2022

Large, Global ELT Publishers Innovate To Meet Evolving Needs
By Jennifer Maguire
Denver, Colo. U.S. – Today’s English Language Teaching industry is evolving, and global ELT publishers must continue providing content and resources to meet the needs of this fast-changing field. The... -
February 10, 2022

English Testing at Home: Convenient and Safe, but Is It Accessible (and Acceptable) to All?
By Michele DeBella
When established, test-development leaders discuss their online English proficiency tests, similar themes emerge. Online tests, most of which can be taken at home, have a wider reach than computer-based tests... -
January 20, 2022

What’s It Like to Teach English for the US Department of State? Voices from the Field
By Dorothy Zemach
The purview of the United States Department of State, more commonly referred to as the State Department, is vast. Broadly responsible for international relations and foreign diplomacy, this executive department... -
December 14, 2021

Bridge Launches English Teacher Empowerment Scholarship to Support Global Educators
By Katharina Schmidt
Due to the COVID-19 pandemic, many English language teachers (ELTs) lost work and had to make significant cuts in their personal and professional lives, including in their own education. To... -
November 11, 2021

The New Frontier of Teaching English: Interactive, Global, Virtual and Innovative!
By Ivana Segvic-Boudreaux
Online instruction made its presence known in the world of education decades ago. However, mobile applications, originally purposed for productivity assistance, are now being used for more than just playing... -
November 4, 2021

Is It Your Mission to Teach English?
By Nicolle Okoren
Natalie Goff, 50, has lived in Nicaragua teaching English as a Christian worker for eight years now with no immediate plan to leave. When the man she was dating told... -
October 26, 2021

What Is the Current State of English Teaching in Afghanistan?
By Dorothy Zemach
Freshta Noori was 11 years old when she started studying English in the fourth grade. She was 19 when she began teaching English while simultaneously working on her teaching certification.... -
October 7, 2021

English Language Teaching Start-ups: Will the Next ‘Unicorn’ Speak English?
By Nicolle Okoren
“Alternative language learning companies are attracting investors and reaching ‘unicorn’ status, a term used in the venture capital industry to describe a privately held startup company with a valuation of... -
September 21, 2021

From English Language Learners to Teachers: Busting the Native-Speakerism Bias
By Andrea Nyilas
These are game-changing times for hiring professionals in the field of English language teaching (ELT). English is one of the key languages shaping the modern world and the language itself... -
September 17, 2021

Are Machine Translation Tools a Threat to English Teaching?
By Dorothy Zemach
If you have long passages, DeepL does come up with language that is more natural overall. But DeepL often mistranslates words and shorter phrases. When Google Translate first launched in... -
September 9, 2021

The Philippines: Emerging From a Sea of Language Learning Destinations
By Katharina Schmidt
The rising demand for English teachers worldwide has provided Filipinos with much-needed employment opportunities and significantly affected other ESL (English as a Second Language) industry stakeholders. Large corporations profit from... -
August 24, 2021

Is Online ESL Education Here to Stay? English Language Teachers Discover Creativity, Opportunity Within Pandemic’s Restrictions
By Ivana Segvic-Boudreaux
At the start of the pandemic, the world came to a halt. Formerly bustling cities were suddenly marked by empty streets, closed businesses, shut down schools and at-capacity hospitals. The... -
July 22, 2021

Going Viral – Can English Language Educators Monetize Their Teaching Through YouTube?
By Dorothy Zemach
Last month, BridgeUniverse explored the ways English language teachers and learners are using Instagram and TikTok. In this article, we’ll continue looking at English teaching outside the classroom by profiling... -
July 9, 2021

Quakes in the Landscape of China’s English Language Education System
By Loren Chiesi
For many years, just having a “white” appearance and a European or North American accent was enough to get an entry-level English teaching position at learning centers around the world.... -
July 1, 2021

The Titans of ELT (Part Two): Defining Diversity and Inclusion Within IATEFL and TESOL
By Loren Chiesi
In part one of our series comparing the International Association of Teachers of English as a Foreign Language (IATEFL) and the TESOL International Association, we explored the structures, challenges and... -
June 22, 2021

Learning Anywhere, Anytime: Will Apps Make English the Lingua Franca of the 21st Century?
By Andrea Nyilas
The concept of English learning is all around us. Opportunities to learn languages at our workplaces or in our communities serve as ways to bring people together and to provide... -
June 1, 2021

IATEFL and TESOL: The Two Titans of ELT (Part One)
By Loren Chiesi
For over 50 years, TESOL International Association (commonly referred to simply as TESOL) and the International Association of Teachers of English as a Foreign Language (IATEFL) have been the two... -
May 20, 2021

Teaching English With TikTok? How Social Media Is Making Microlearning Big Business
By Dorothy Zemach
Microlearning — instruction delivered in short, bite-sized chunks — has become increasingly popular in the corporate world for in-service training. Although the term was coined back in 1963 by Hector... -
April 28, 2021

ELT Entrepreneurs Come to Bridge as YLAI Fellows, Leave as Leaders
By Vicki Colbert
Although cliché, there’s a Roman proverb that still rings true with many thriving entrepreneurs: “Luck happens when preparation meets opportunity.” Raquel Castro knows that feeling entirely. At 10-years-old, she acquired... -
April 5, 2021

Bridge Partners With Latin American Governments to Support English Teacher Development
By Catarina Chase Aleixo
Education systems in Latin America are prioritizing English language proficiency as a necessary skill for graduates to be equipped for success in an increasingly globalized world, according to a report from... -
April 1, 2021
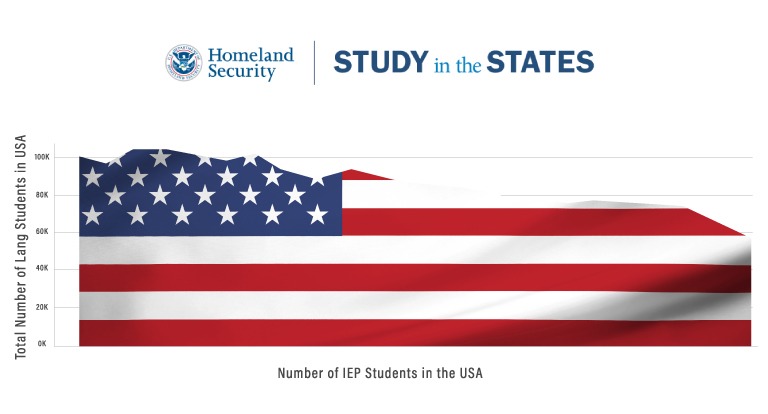
U.S. Intensive English Programs: Short-Term Volatility or Long-Term Decline?
By Jean-Marc Alberola
Intensive English Programs (IEPs) in the United States provide English language instruction to international students and visitors. Traditionally, this has been primarily through Academic English programs, offering preparation for study at... -
January 29, 2021

English Test Providers Jockey for Position as Pandemic Accelerates Online Trend
By Nick Thomas
Luis von Ahn, the co-founder and CEO of Duolingo, had to travel to the neighboring country of El Salvador to sit his English language proficiency exam for a U.S. college... -
January 28, 2021

Are ‘SIGs’ the Unsung Heroes of English Teacher Associations?
By Vicki Colbert
There are many reasons to join a global or regional community of English language teaching professionals. Membership to the International Association of Teachers of English as a Foreign Language (IATEFL)... -
November 5, 2020

Online ELT Marketplaces: How They Work, What They Charge & How to Make the Most of Them
By Catarina Chase Aleixo
When thriving language–learning app, Busuu, acquired video-tutoring language marketplace, Verbling, back in mid-January 2020, it was perhaps not fully aware of quite how prescient its “double-digit million dollar acquisition” had been. At... -
September 30, 2020

ELT Conferences Go Virtual: Is This the Future for Industry Events?
By Vicki Colbert
Each year there are an estimated 80 or more ELT (English Language Teaching) conferences across the globe. They come in all shapes and sizes. Many are grassroots events organized by teachers volunteering... -
September 30, 2020

Native Speakerism: Discriminatory Practice or Response to Market Demands?
By Catarina Chase Aleixo
English has become the world’s first truly global language. It is the global lingua franca for business, diplomacy, and tourism; it is the unofficial first language of the Internet; and...